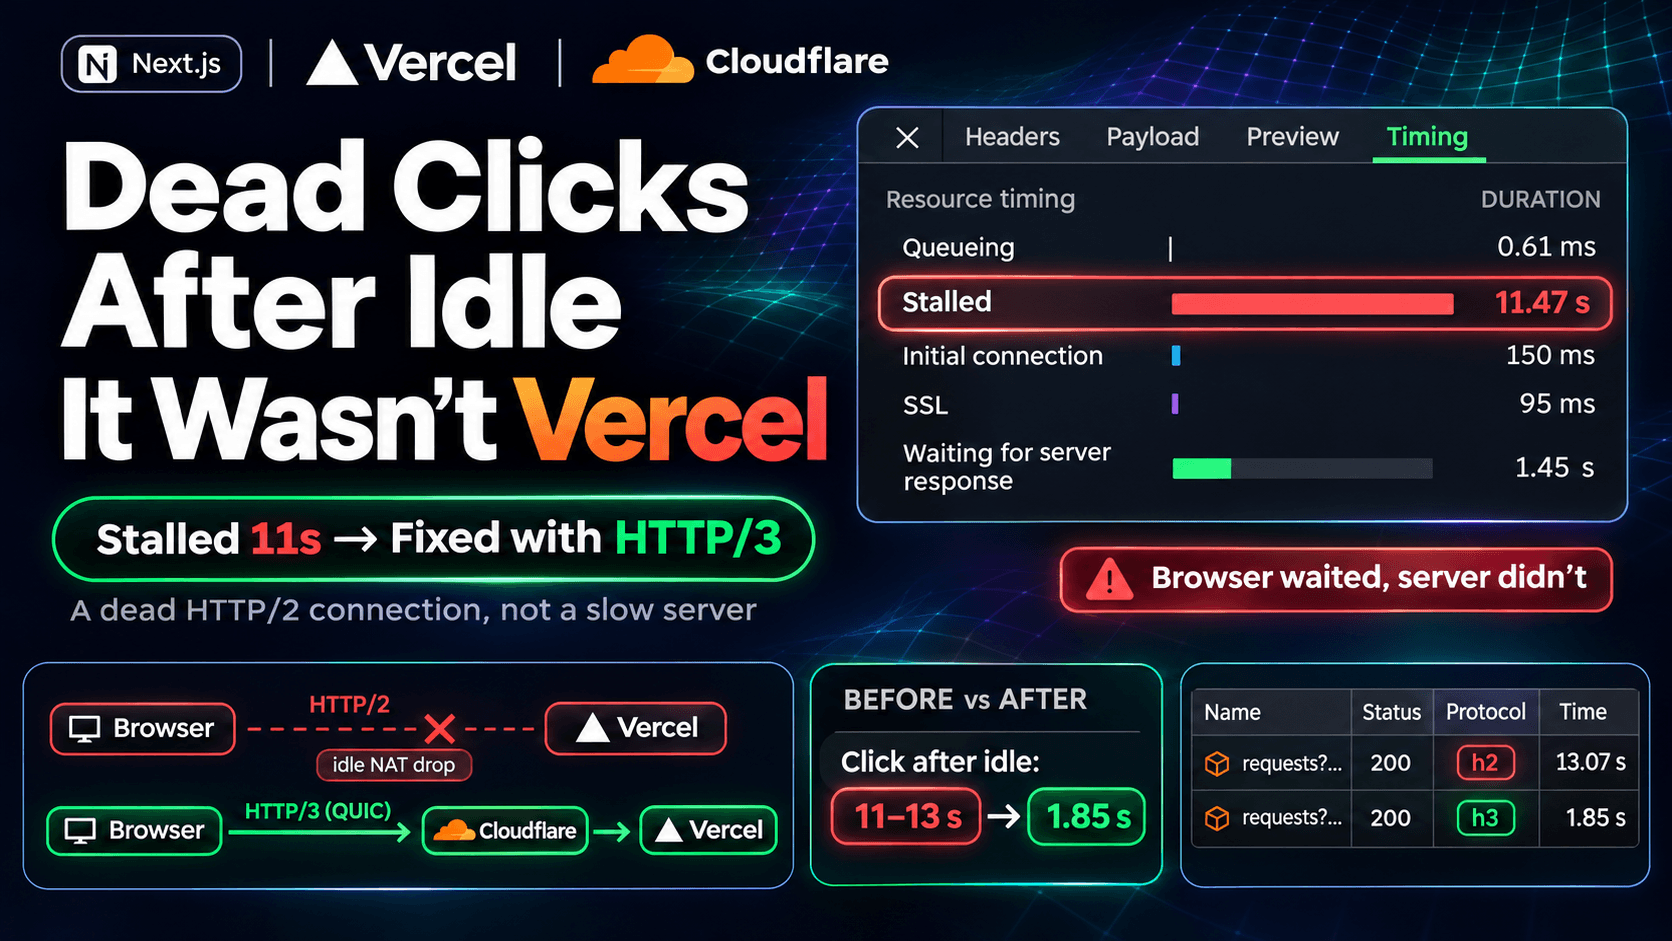
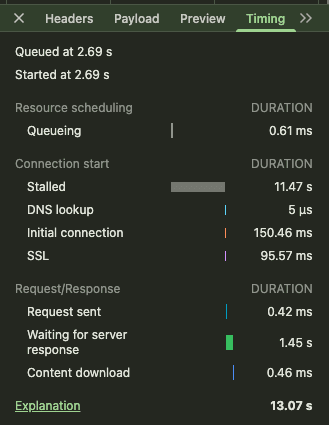
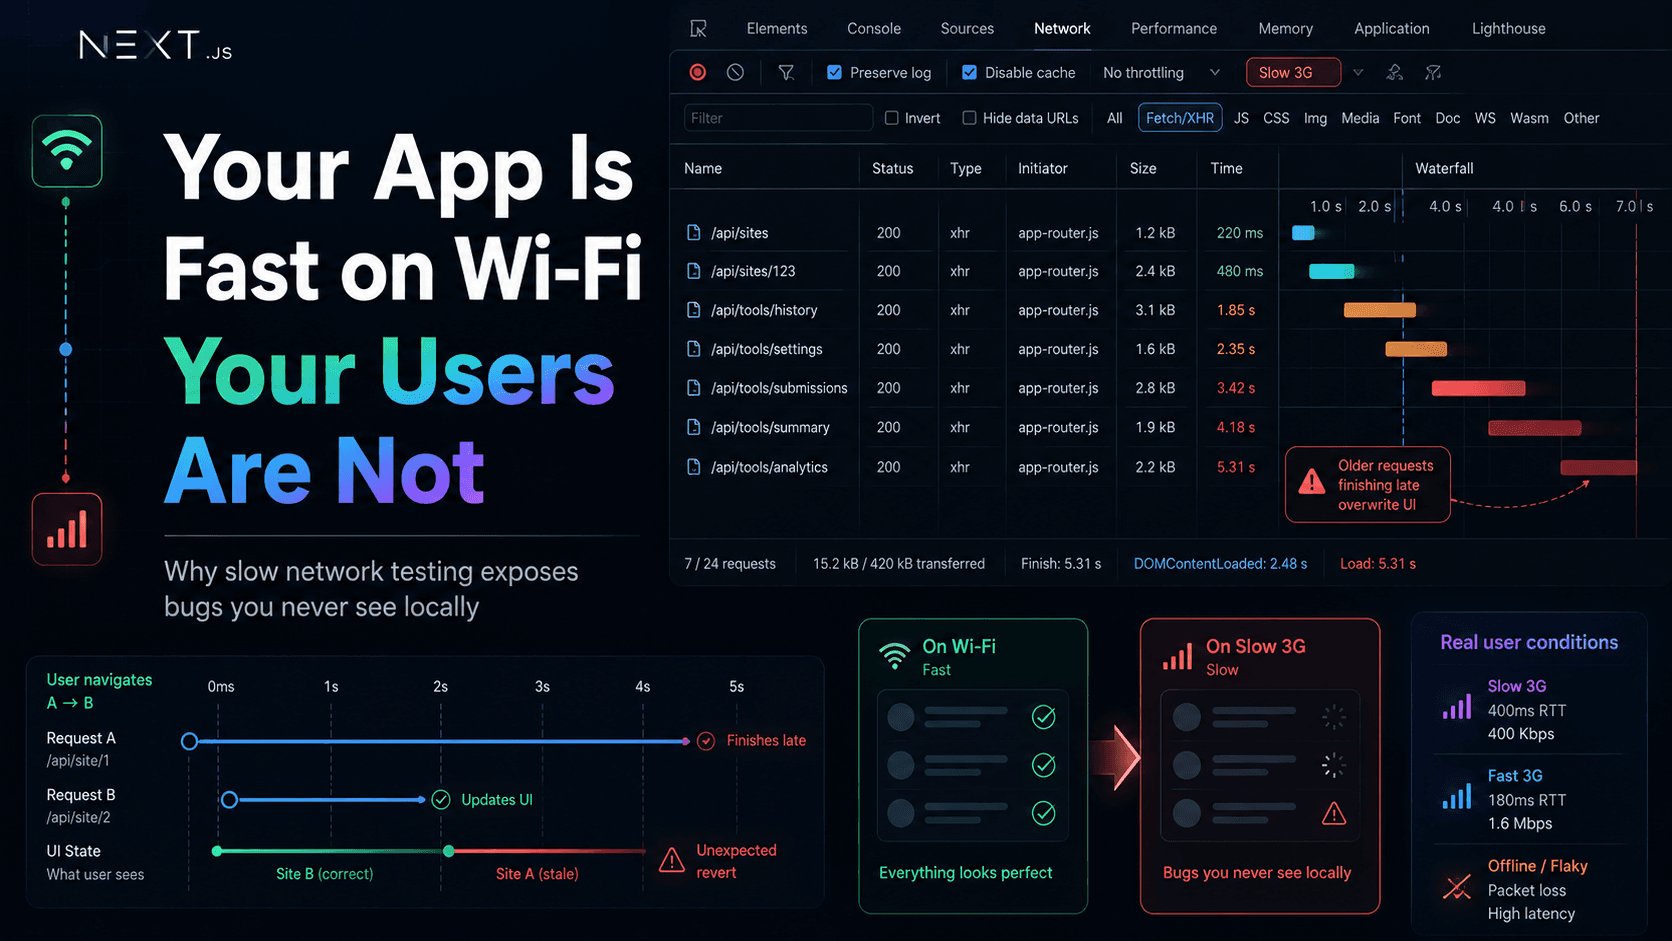
I have 2–3 Next.js apps on Vercel. One is a CRM, the others are admin-style dashboards. All of them had the same strange problem for a long time, and I could never catch it properly.You click a link and nothing happens. No loader, no error. You click again, still nothing. Then after around 10 seconds the page suddenly opens like everything is normal.For months I was sure this was a Vercel problem. Cold start, bad region, something on their side. I even told a friend, "this is 100% Vercel."It was not Vercel. Vercel replied in about one second. My browser waited eleven seconds before it even sent the request.
I switch to another tab, take a call, come back after 1–2 minutes.
I click a sidebar link. Nothing.
After 10–13 seconds the page opens.
The next few clicks are fast again.
Saving a form had the same problem. After some idle time, submit would just hang and then go through late.It was hard to show to anyone, because it only happened when you stopped using the app for a bit. And the backend API (a separate Node.js server) never had this problem. Only page navigation in the Next.js apps did.
With HTTP/2 the browser keeps one long TCP connection to a site and sends every request on it. Normally that's good, because you don't pay for a new handshake on every click.The problem is in the middle. Home and mobile internet providers (especially here in India, where a lot of networks use carrier-grade NAT) keep a table of open connections. If a connection is idle for some time, they can silently remove it. Nobody tells the browser or the server.So the browser thinks the connection is still alive, and this happens:
File
text
1. Click → Chrome uses the old HTTP/2 connection
2. Packets go out... and get lost (the NAT forgot this connection)
3. No reply. Chrome waits and tries again.
4. Finally it gives up on that connection
5. Opens a new TCP + TLS connection (150 ms + 95 ms)
6. Sends the request, server replies in ~1.4 s
Steps 2 to 4 are the 11-second "Stalled" bar. The server was not even involved.To be honest, I did not capture packets on the ISP side, so I can't show the NAT drop directly. But this explanation matches everything I saw. It only happened after idle, a new connection came after the stall, the server logs were fast, and one other site on the same network had no problem at all.
That other site was the clue. My backend API was already behind Cloudflare, and its responses had this header:
File
text
alt-svc: h3=":443"; ma=86400
This tells the browser it can use HTTP/3 for that host. HTTP/3 runs on QUIC over UDP, and it handles this case much better:
A QUIC connection has its own connection ID. It is not tied to IP and port, so if the NAT changes something, the connection can continue.
If a QUIC connection really is dead, Chrome finds out fast. Later I saw an error on the API fail in about 650 ms and retry right away, instead of hanging for 11 seconds.
My Next.js apps were served directly by Vercel. Those responses had no alt-svc header, so Chrome stayed on HTTP/2 over TCP, which is exactly what breaks after idle. I also couldn't find any setting in Vercel to change the idle timeout.Same browser, same Wi-Fi, same idle time. One site was on HTTP/3 and worked fine. The others were on HTTP/2 and got stuck.
The simple hack is to ping the server every 30 seconds so the connection never goes idle.I actually built it, and then removed it. On Vercel every ping is a request that you pay for. In the CRM and admin apps, people keep 10 or more tabs open the whole day. That's thousands of useless requests per user per day just to keep a connection warm. It's fixing a network problem in the wrong place.
So I gave the Next.js apps the same thing my API already had: HTTP/3.My DNS was already on Cloudflare. The app domains pointed to Vercel with DNS only (grey cloud). I changed those records to Proxied (orange cloud).Now the browser talks to Cloudflare using HTTP/3, and Cloudflare talks to Vercel on its own warm connections:
Right after the change, requests started showing h3:
After switching to the Cloudflare proxy, the protocol column shows h3.The real test was idle. I left the tab for about 27 minutes, came back, and clicked:
27 minutes idle, then a click: 1.85 s and no stall. Before this it was 11+ seconds.
The last row is important. The proxy is not free. There is one more hop now, and on Cloudflare's free plan my traffic from India goes through Singapore, not Mumbai. Funny thing: cloudflare.com itself was served from Hyderabad on the same network, so it's a plan thing, not a location thing. A warm curl went from about 0.16 s (direct) to about 0.5 s (through the proxy).I'm fine with that. A steady extra 150 ms is much better than a random 11-second freeze where users think the app is broken.
This setting changes email addresses in your HTML and adds a small script to decode them. If your Next.js app has a strict Content Security Policy with nonces, that script gets blocked. Users see [email protected] instead of your real email, and React also complains because the HTML changed. Turn it off.
On proxied domains, Cloudflare can inject its analytics script from static.cloudflareinsights.com. My CSP blocked it and the console was full of red errors. Either allow it in CSP (script-src https://static.cloudflareinsights.com and connect-src https://cloudflareinsights.com) or turn Web Analytics off.
Vercel creates SSL certificates for your domains. A wildcard certificate needs a DNS check, which only works if Vercel manages your DNS. Normal single-domain certificates can still renew through the proxy. I put a reminder to check the certificate status in Vercel before the current one expires.
Only the website A / CNAME records get the orange cloud. Keep MX, email DKIM records (for example from Amazon SES), CAA and verification TXT records as DNS only.
After the switch, one request was still going over an old direct HTTP/2 connection, sitting right next to an h3 one:
Chrome was still reusing an old direct h2 connection for some requests.Open chrome://net-internals/#sockets → Flush socket pools, and clear the host cache under #dns. Otherwise you are still testing the old path and wondering why nothing changed.
I keep prefetch={false} on sidebar links. Prefetching every link as soon as the page renders means one server request per link on every page load, and on Vercel those are billed function calls. So I prefetch only when the user shows intent:
There are usually 100–300 ms between hover and click. That's enough to hide most of the extra hop.I added this only on things people actually click: sidebar, menus, back buttons, action buttons. Not on table rows or long lists, because moving the mouse over a list would fire 20 requests.
A loading.tsx in a route folder keeps the sidebar and header on screen and shows a skeleton while the new page loads. So the click feels like it did something right away. I added these only to logged-in pages. Public pages that matter for SEO render real content and don't use them.
One page was still slow for a different reason. A sidebar counts API took about 2 seconds, because it counted everything again on every request. I changed it to stale-while-revalidate: return the last counts immediately and recount in the background if they are older than 30 seconds. That one was not a network problem at all. So always look at Waiting for server response before blaming the network.
I wasted a lot of time because I looked at the wrong number. Vercel said "1.4 seconds", the user felt eleven. Both were true, they just measured different things.Now when a click "does nothing", I do this:
Open Timing, not just the total time.
If it's Stalled, the browser hasn't even sent the request. That's a connection problem, not a server problem.
Compare with another site on the same network. If that one is fine, check what's different in how it's served before touching the code.
Common questions about idle stalls, HTTP/3 and Cloudflare in front of Vercel
Is this a Vercel cold start?
Most likely not. A cold start shows up as a long function time in Vercel logs and a long Waiting for server response in DevTools. A dead idle connection shows up as a long Stalled time, then a new connection, while the server time stays normal.
Why does HTTP/3 fix it?
HTTP/3 runs on QUIC, which uses a connection ID instead of IP and port, so it survives NAT changes. And if a QUIC connection really is dead, the browser notices quickly instead of waiting on TCP retries.
Does Cloudflare in front of Vercel make my site slower?
It adds one hop. For me a normal click went from about 280 ms to about 430 ms, partly because free-plan traffic from India goes through Singapore. In return, the random 10-second freezes after idle stopped.
Why not just use a keep-alive ping?
It works, but every ping is a billed request on Vercel, and it multiplies with every open tab. Fixing the protocol is cheaper and helps every user.
Which Cloudflare settings should I change for a Next.js app?
Turn off Email Address Obfuscation, use SSL Full (strict), keep Rocket Loader off, and either allow Cloudflare Web Analytics in your CSP or turn it off. Don't add "Cache Everything" rules on top of Next.js caching unless you know exactly what you're caching.
Will this affect SEO?
Not by itself. Just make sure Cloudflare's bot settings don't block Google, it isn't changing your robots.txt, and keep an eye on Core Web Vitals, because the extra hop can add to time to first byte.
How do I make Chrome drop an old connection while testing?
Go to chrome://net-internals/#sockets and click Flush socket pools, then clear the host cache under #dns. Otherwise Chrome may keep using the old direct connection.